Data Artist Dr. Kirell Benzi as an extraordinary superpower. The CG Spectrum alumnus reveals the hidden beauty of complex data. We're not talking pie charts and graphs. We're talking incredible pieces of art you'd want hanging on your wall.
Take this piece for example: The Dark Side and the Light shows the conflict raging in the Star Wars galaxy based on 20,000+ characters. The shades of blue nodes represent the light side of the Force, the dark side is in red, and the yellow nodes expose the likes of criminals and bounty hunters.

Kirell's passion for digital art began at a young age, when he began making abstract visuals based on photos that combined both art and computer science. In 2016 he received a Ph.D. in Data Science and his work has since garnered international attention. He is often invited to speak at conferences and gave a keynote on data art at TEDx Annecy, France.
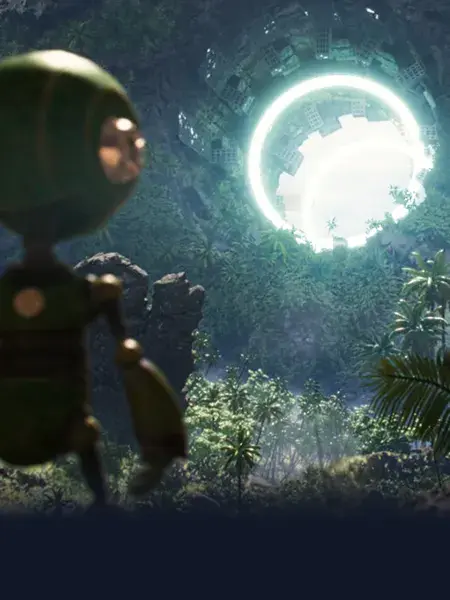
In 2019 Kirell completed CG Spectrum's Houdini FX course, and used the powerful software in a colossal collaboration with prestigious Swiss university École Polytechnique Fédérale de Lausanne (EPFL) in celebration of their 50th anniversary.
In partnership with the famous Montreux Jazz Festival, Jazz Luminaries was a spectacular event that gave visitors a once-in-a-lifetime chance to relive some of the world's most iconic concerts in an interactive 3D data sculpture.
Kirell and his team transformed the Montreux Jazz Festival's media database of more than 13,000 videos and 5,400 cuts, mixes and replays of historic performances to create a unique 3D data full-dome installation for music fans to enjoy. The project featured artists like Miles Davis, BB King, Santana, Aretha Franklin, Quincy Jones, Etta James, Queen, Sting, Michael Jackson, Led Zeppelin and ABBA.
 Jazz Luminaries: Kirell Benzi's collaboration with EPFL earlier this year (Image: Havas)
We were thrilled to catch up with Kirell to learn more about how he's using Houdini, data and machine learning to create art which evokes powerful emotional responses, and hear about his upcoming projects.
Kirell, you walk the line between artist and data scientist. How did you find your way into this niche?
I started creating abstract digital art when I was a teenager and I’ve always been passionate about technology.
During my Ph.D. in Data Science, I realized that I needed more visual elements to answer the classical “what are you working on?” question in a non-boring way.
I realized that I could fuel my love for the abstract visuals of my youth but based on real scientific phenomena this time. This small revelation is how I became a data artist.
I’m not alone in this artistic movement and the data art community is growing every year. However, my artistic approach is singular in the fact that I use data art to communicate positive emotions towards science, trying to advocate for a better understanding of Big Data and Artificial Intelligence.
Deep Sea follows the tide of the Atlantic Ocean near Bordeaux, France, looking at the augmentation of sea levels in relation to climate change.
For Jazz Luminaries, you dusted off big data from old archives and created something tangible for people to interact with in the present day. How did this project come about? What challenges did you face bringing it to life?
I started my thesis working on a smart AI-powered music recommendation system that was used at the Montreux Jazz Festival.
This project was the culmination of years of work in the field with the EPFL [the prestigious Swiss university] in charge of digitizing all the archives. The project was initiated by Prof. Sarah Kenderdine, curator of the ArtLab, the EPFL art/science museum.
We were 8 people working on the project for a few months. I was in charge of creating the 3D artwork with a bit of previz and prototyping.
The main challenge was the digitization of the archive and real-time access to its 2.7 PiB (2700 terabytes) of data!

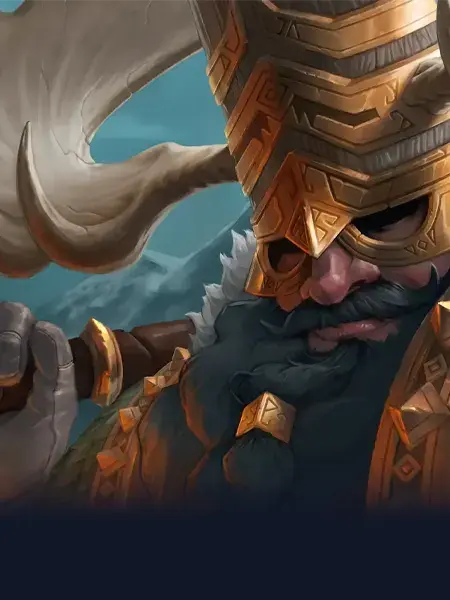
Jazz Luminaries: Kirell Benzi's collaboration with EPFL and Montreaux Jazz Festival
We had tons of issues to solve as you can imagine, the most difficult was in terms of user experience as each participant needed to fully enjoy the experience regardless of their position in the dome. We had to design a specific hardware controller to do just that.
How did it feel seeing people interacting with data that might otherwise be tucked away on a computer or in a folder? What response did you receive from the public?
We were thrilled to have an overwhelming response from the audience, but we were also very lucky to work on this magnificent corpus.
Imagine that you could spend 6,000 hours listening to exclusive, never released footage of the greatest artists of all time. Pretty cool for a son of a musician like myself.

Why did you decide to enroll in CG Spectrum's Houdini course? What did you take away from the experience? How did you use Houdini for Jazz Luminaries?
Houdini is the best software I’ve ever worked with to create digital assets. As I’m only interested in procedural, data-driven creations, it was natural for me to choose the best tool for the job.
I liked CG Spectrum’s MOOC approach and the possibility to have a personal mentor. The key selling point for me was the possibility of adapting the online courses to my specific needs.
I have several ongoing projects that will require Houdini’s powerful solvers and scripting capabilities. My ultimate dream would be to have a real-time renderer and the possibility to create interactive things with it.
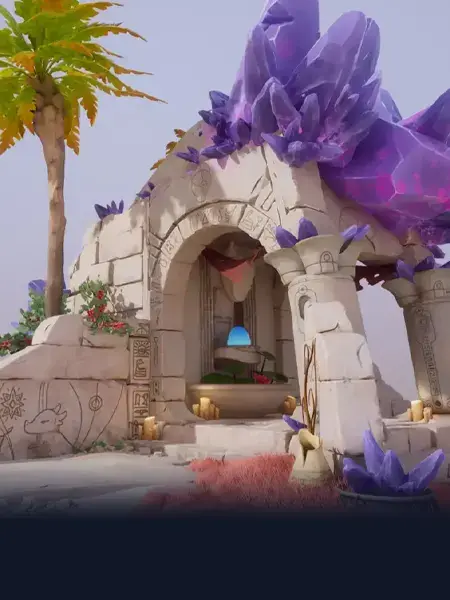
 Breathe: Created at the start of the COVID-19 pandemic, this data fractal was inspired by the human body. In this image, the number of rings counts the months since COVID began to make headlines.
What excites you about merging data and emotion? Who/what inspires your work?
I follow many different artists on Instagram in CGI-related fields but also in more traditional art media such as paint or sculpture.
I think one of the keys to be creative is to be constantly exposed to many different styles, you never know when and from where the inspiration will come. I like mixing data and emotions because it is an unlikely combination.
Most people perceive data as cold, scary, and complex. I like to reveal the hidden beauty of complexity.
 When the Sun Sets was created using artificial intelligence trained from millions of images.
What other tools are you using to create data art?
Mostly data science related libraries in Python and frontend dataviz frameworks such as d3.js or three.js. I’m also learning node-based real-time 3D graphics tools such as TouchDesigner or cables.js. I wish Houdini was real-time because it is more powerful and the user interface is more intuitive than the other alternatives.
What type of organizations approach you to turn their data into art?
Most of my work is done with institutions and agencies. I also had projects with large corporations that seek to make sense of the huge amount of data they have collected over the years.
Quite recently, I realized that we could also create ultra-personalized gifts for loved ones using personal data that you willingly share.
The General Data Protection Regulation law in Europe has forced corporations to give people their data back. Anyone can get a data art piece from their Instagram, Facebook, Spotify, or YouTube profile for instance.
Evading Confinement: An AI-generated art piece inspired by the COVID-19 global lockdown.
Tell us about your work with AI. What are you most excited about and what are your concerns (should we be scared of robots)?
Please don’t be scared of robots! There is no intelligence in “artificial intelligence”, just clever maths and very big datasets.
However, machine learning (the correct name for what we have been researching for the past 40 years) will change all jobs as the computer did.
It is very exciting to see how it will impact the way we create things. Developing AI tools for artists is a booming industry that has been largely forgotten compared to classical object detection/recognition for instance.
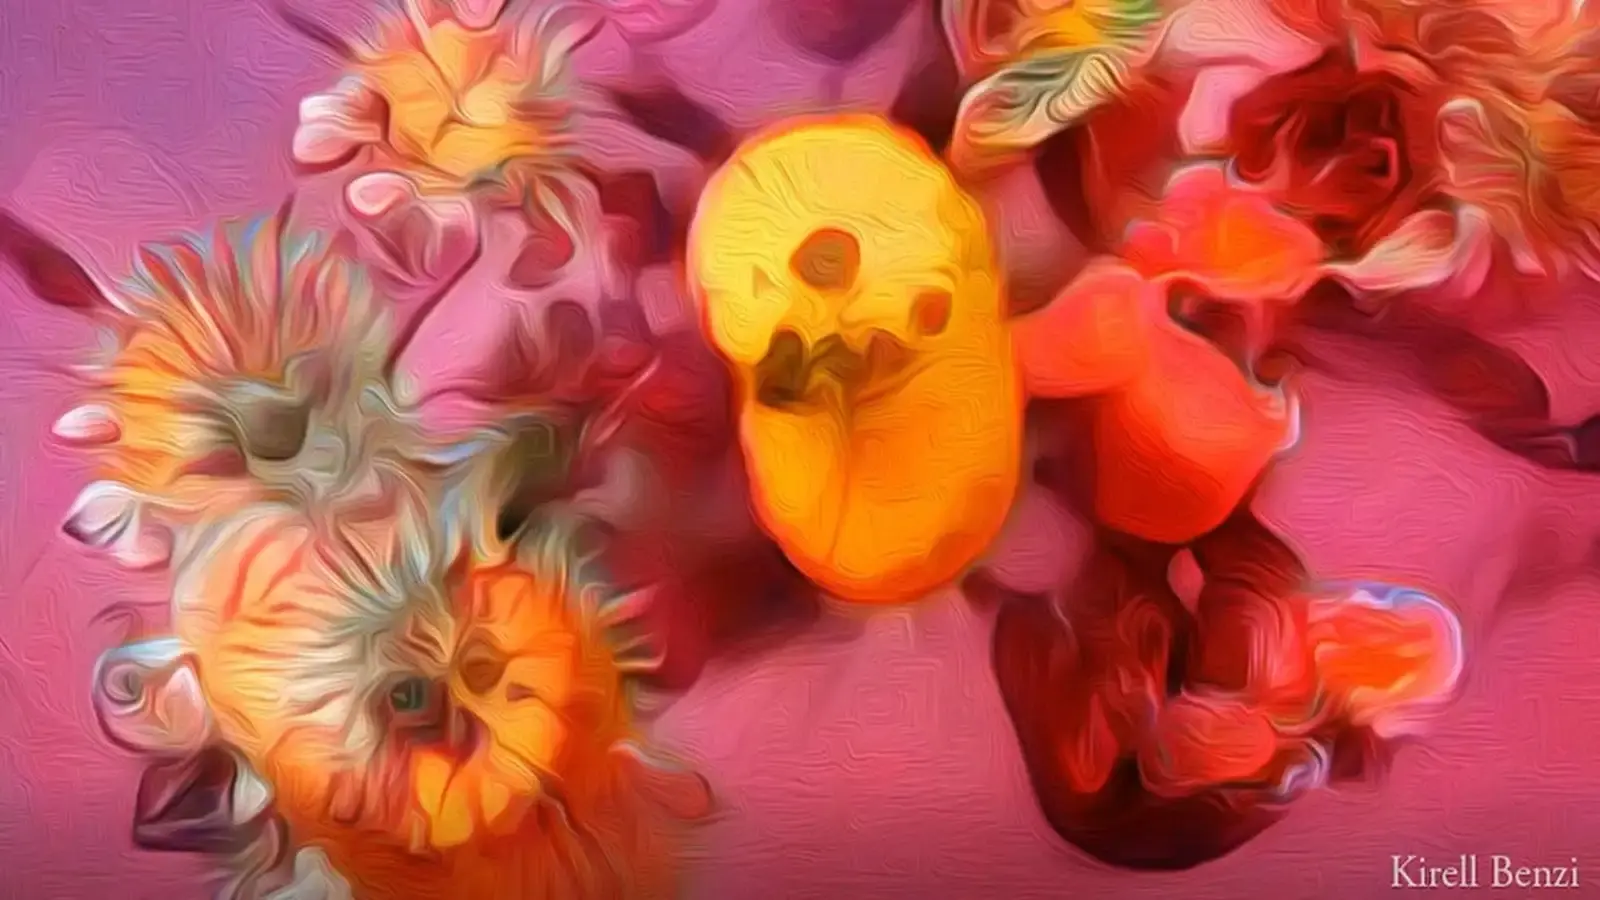
I’ve been exploring generative algorithms with AI in my recent works using neural networks trained on millions of everyday images. Once the network is trained, we can synthesize fresh new images, called machine hallucinations, using a combination of the original image inputs.
For instance, I can ask the algorithm to mix 30% of a pig, 20% of a car, 10% of a lamp, and 40% of a chair. This combination is very difficult for us to imagine and thus to draw but very easy for a neural network, if you are curious, check out this piece:
Are you also exploring VR?
Yes, I have some R&D projects using Mozilla Hubs (like Zoom in VR) and I also created ephemeral art galleries on several crypto platforms such as Cryptovoxels and Decentraland.
The only issue I have right now is that virtual lands are really expensive and the traffic very low. When the hardware will become more powerful and more convenient the switch to VR/AR will make these kinds of projects more relevant.
What emotions do you hope to evoke with your work? Have you had any surprising or unexpected reactions from people seeing your art?
Measuring the effect of my work on people is of real interest to me (my scientist side I guess).
I created a 5 minute study that you can fill online on this very topic in the hope of publishing a scientific article once I gather a sufficiently large number of responses.
From the answers so far, it seems that reading the description of a piece can influence your perception of it. More than 84% of people found that Data Art is a good medium for science communication.
In general, I would like people to be attracted by the visual in its complexity and beauty. Then I hope that they read and understand the data and scientific techniques used to create it. Data artworks combine emotions and cognition, which is the perfect combination to stimulate all the parts of our brain.

AI Animal Textures by Kirell Benzi
What's next for you? Any cool upcoming projects you can share with us? How about the online course you are thinking of launching - who will it be for?
I’m working on a set of courses related to “Data Artistry”. It will cover everything you need to start from scratch with data fundamentals, data visualization, creative coding, data science, machine learning, and data art masterclasses.
I’m taking my time because I want the format to be original and go beyond the mere online videos that we find everywhere. No prior experience required, it will be open to all.
What are your thoughts on the future of data art?
I think there is a bridge to create between the VFX industry and the data science community. If you think about it, the most successful science shows are in astrophysics thanks to the quality of the visual effects.
I would really like to collaborate with Houdini experts to push the limits of data art and data science communication in the third dimension. If you find this idea exciting, let’s get in touch!
See more of Kirell's incredible work on his website: www.kirellbenzi.com and connect with him on Instagram, Twitter and LinkedIn.
Explore the power of Houdini FX with an industry mentor as your guide!
Whether you're keen to get into data art and visualization, or want to create unreal visual effects for film and games, CG Spectrum's Houdini course is taught by professional FX artists who have worked on blockbuster films and AAA games. Get started today!
Related Links